Visu Element XY Chart Example
Demonstration of how to use the 'XY Chart' visualization element.
UnlicenseHome
Visu Element XY Chart Example
This sample project demonstrates how to use the 'XY Chart' visualization element.
Product description
The sample project 'XYChartExamples' includes three applications for the 'XY Chart' visualization element.
This 'XY Chart' visualization element displays the curve of array values graphically as a line or bar chart in the Cartesian coordinate system.
The sample project includes applications covering the following topics:
- Curve overlapping
- Curve programming
- Zooming and panning
More information
Application XYChartCurvesOverlapping
The application demonstrates how to use the overlapping mode.
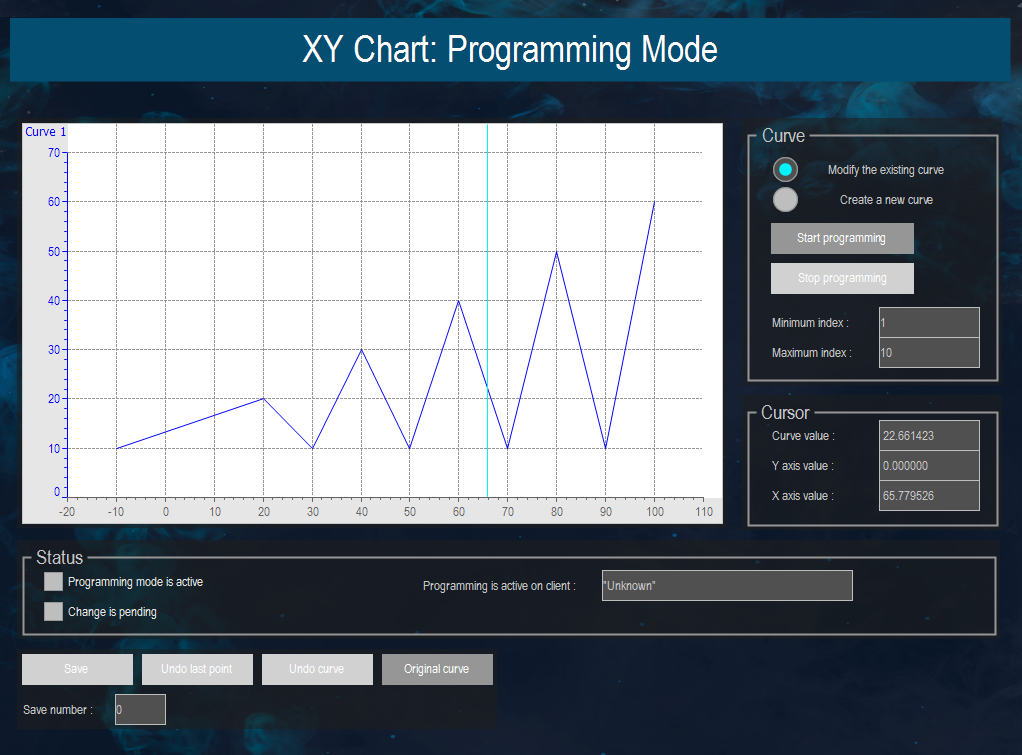
Application XYChartProgrammingMode
The application demonstrates how to use the programming mode.
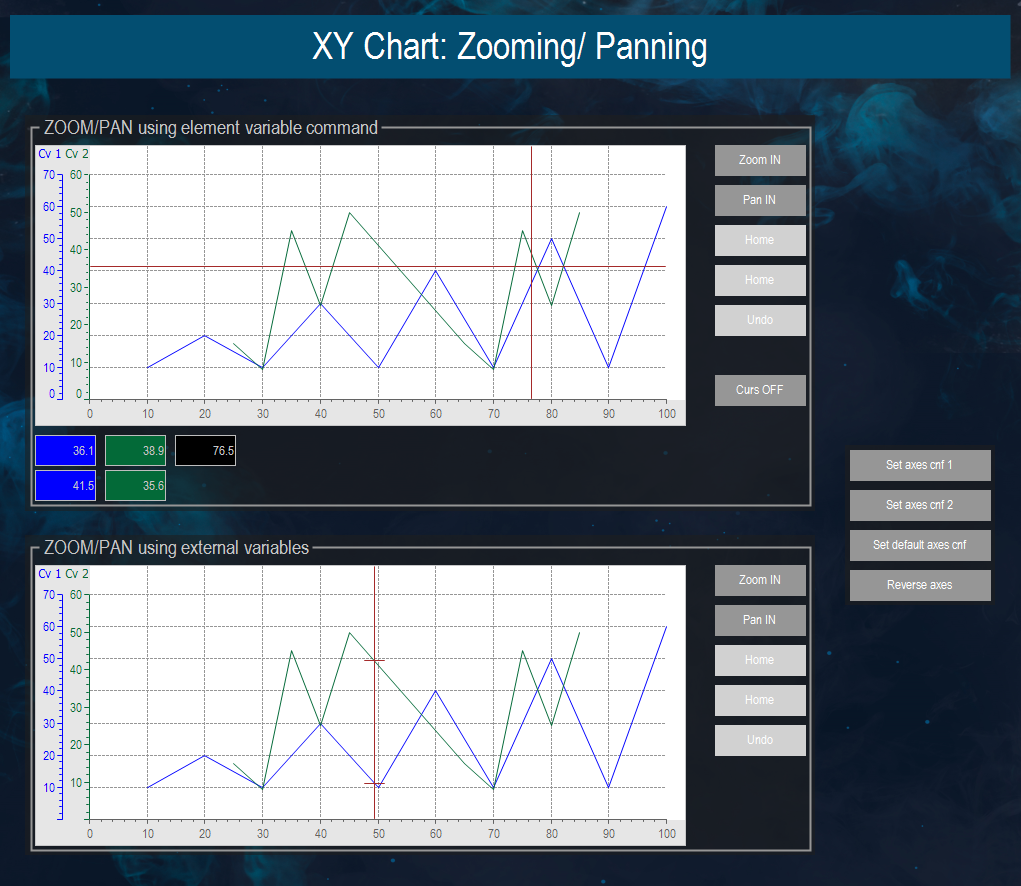
Application XYChartZoomingPanning
The application demonstrates how to use the zoom and pan function.
System requirements and restrictions
| System requirements and restrictions | Info |
|---|---|
| Programming System | CODESYS Development System Version 3.5.14.0 or higher |
| Runtime System | CODESYS Control Version 3.5.14.0 |
| Required Accessories | - |

Application XYChartCurvesOverlapping
Application XYChartProgrammingMode
Application XYChartZoomingPanning